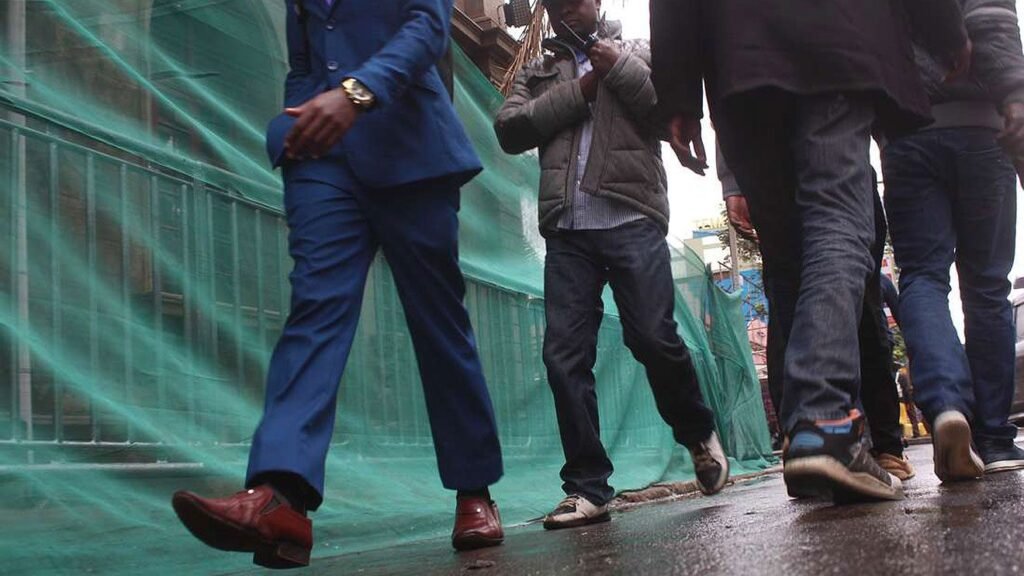
The distribution of the male working population in Kenya reflects important socioeconomic trends, including variations in labour force participation, access to employment opportunities, and regional economic disparities.
Understanding these patterns is vital, as they are influenced by factors such as education levels, local economic structures, migration trends, and cultural expectations surrounding male roles in the workforce.
The table below presents the estimated number of working males across various counties in 2022. This data provides key insights for policymakers, economic planners, and labour market analysts by highlighting regions with high or low male workforce participation. Such information is instrumental in designing targeted employment programmes, addressing regional inequalities, and promoting balanced economic development.
Male Working Population by County (2022)
| County | Male Working Population |
|---|---|
| Nairobi | 1,215,840 |
| Kiambu | 674,125 |
| Nakuru | 495,216 |
| Machakos | 376,074 |
| Kakamega | 357,256 |
| Meru | 355,215 |
| Kilifi | 313,875 |
| Kajiado | 312,461 |
| Murang’a | 311,710 |
| Bungoma | 318,371 |
| Kisii | 272,076 |
| Kisumu | 263,392 |
| Mombasa | 283,541 |
| Migori | 236,532 |
| Makueni | 226,992 |
| Narok | 229,048 |
| Homa Bay | 217,617 |
| Nyeri | 216,189 |
| Nandi | 209,713 |
| Kitui | 197,092 |
| Kericho | 196,205 |
| Siaya | 194,232 |
| Bomet | 193,308 |
| Busia | 191,012 |
| Embu | 182,755 |
| Baringo | 166,605 |
| Nyandarua | 166,028 |
| Kirinyaga | 165,133 |
| Kwale | 156,379 |
| Trans Nzoia | 147,549 |
| Vihiga | 130,702 |
| Nyamira | 120,676 |
| Tharaka-Nithi | 117,853 |
| Laikipia | 116,864 |
| Wajir | 113,053 |
| Garissa | 102,529 |
| Elgeyo Marakwet | 95,522 |
| Taita Taveta | 90,204 |
| Turkana | 89,546 |
| Mandera | 86,450 |
| Marsabit | 71,490 |
| Tana River | 56,010 |
| Isiolo | 32,805 |
| Samburu | 29,277 |
| Lamu | 27,099 |
Source: Kenya National Bureau of Statistics


